Here’s a puzzle. The puzzle involves satellite-derived tropospheric temperature estimates. These temperature estimates are created from AQUA satellite data. UAH offers the daily data at their website. AQUA’s channel 5 data is thought to reasonably represent the bulk of the troposphere.
The puzzle is an intraseasonal oscillation in the data which I’ve been unable to identify – Intraseasonal Oscillation “X” or “IOX” for short. My hope is that someone can identify IOX.
Here’s the story. The channel 5 data varies over time, mainly due to annual cyclicity and ENSO-related effects. It is possible to (mostly) remove the annual cycle and ENSO effects, as explained here , leaving the higher-frequency variability.
Below is a channel 5 time series example (2005-2006) in which the annual cycle and ENSO effects have been removed, leaving the higher-frequency variability. These values (the daily anomalies with ENSO removed) I term as “adjusted daily anomalies” or “ADA” in this post.
This time series’ appearance is interesting in several ways. One, the tropospheric temperature changes are often rapid for several days – sharp rises and equally sharp falls. Two, the rapid changes sometimes come to an abrupt stop, pause for several days then rapidly move in the opposite direction. Three, despite the rapid changes, the temperature anomalies generally stay within a band of+0.2K to -0.2K. These appearances warrant exploration, but not in this post.
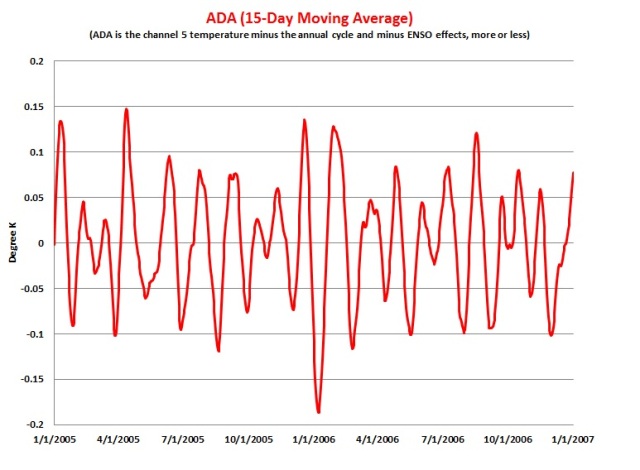
What would this ADA time series look like if the very high-frequency variability was also (mostly) removed? To explore that, here is a plot of 15-day moving averages of ADA (“adjusted daily averages”) for 2005-2006:
This smoothed channel 5 data appears to be oscillatory. Typically, about every 25 to 40 days, the channel 5 data warms and then cools by around 0.1 – 0.2 K.
Is this oscillatory appearance confined to the example 2005-2006? No. A similar plot covering eight years (2003-2010) is here . The 2005-2006 data is representative of the full period.
Regarding the period of the oscillation, a plot of days-between-peaks for 2003-2010 is here . Most of the days-between-peaks are between 20 and 45 days, a bit shorter than the 40 to 50 day oscillation period generally associated with the Madden-Julian Oscillation (MJO).
Perhaps this apparent oscillation is not real. Perhaps it is a data artifact or the consequence of gathering oxygen radiance data by satellite. Perhaps the simple approach is fundamentally flawed and I am seeing ghosts.
Or, maybe it is real. If IOX is associated with a real, known tropospheric phenomena, which one?
The physical nature of such an oscillation, if it is real, is intriguing. Some of the questions which cross my mind are here, as well as a list of possible oscillations.
Here’s a possible clue about IOX’s identity (or maybe it adds to the mystery): suppose that the 2003-2010 smoothed ADA time series is broken into its annual sections, so that the oscillation’s behavior over the course of a calendar year can be seen. Here is the plot of that, covering 2003 thru 2010. The plot looks disordered, like spaghetti.
Suppose, though, that the oscillations for each calendar date are averaged. This average is an indication of the relative amplitude of the oscillations for each calendar date. Here is that plot:
This plot seems to show that ADA amplitude varies in a rather orderly way over the course of a year. An amplitude peak is realized about every 21 days, with a (usually) distinct trough in between. This is unexpected and mystifying to me.
Also, the black (moving average) line indicates that amplitude tends to peak in midsummer and midwinter and go through a minima in spring and again in fall. This is not so surprising – global temperature/energy differences are probably less during an equinox than in a solstice.
What in the world (er, atmosphere) is all this about? If it is real then how does this oscillation physically correlate with the calendar? Why 21 or so days between amplitude peaks (a plot of the count of days between maxima is here )? If the oscillations are due to changes in tropical thunderstorm activity, as in MJO, then what is this 21 (or so) calendar-based amplitude oscillation about?
The Excel spreadsheet containing the data, calculations and plots is here
So, what is X?


This paragraph will assist the internet viewers for setting up new website or even a blog from start to end.|